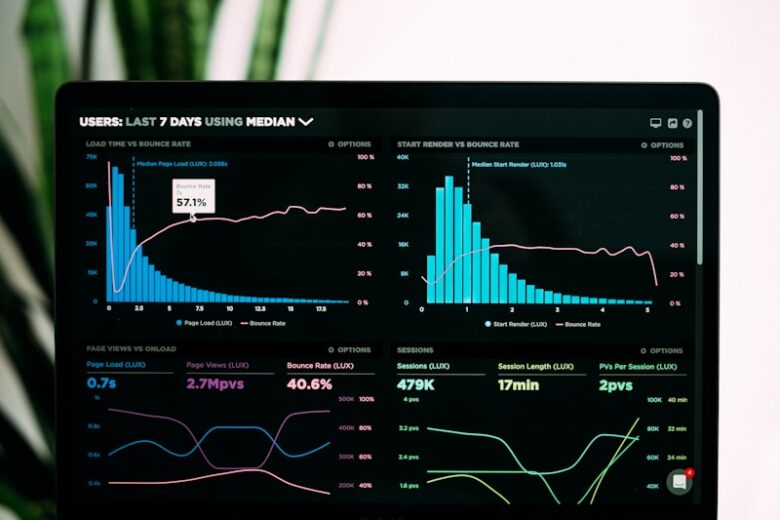
Observability goes beyond traditional monitoring by providing deep insights into system behavior through metrics, logs, and traces. Distributed tracing is essential for understanding request flows across microservices architectures.
Three Pillars of Observability
- Metrics: Numerical measurements over time (latency, error rates)
- Logs: Discrete events with context
- Traces: Request journey across services
OpenTelemetry Setup
# Python - OpenTelemetry instrumentation
from opentelemetry import trace, metrics
from opentelemetry.sdk.trace import TracerProvider
from opentelemetry.sdk.trace.export import BatchSpanProcessor
from opentelemetry.exporter.otlp.proto.grpc.trace_exporter import OTLPSpanExporter
from opentelemetry.instrumentation.flask import FlaskInstrumentor
from opentelemetry.instrumentation.requests import RequestsInstrumentor

# Configure tracing
trace.set_tracer_provider(TracerProvider())
tracer = trace.get_tracer(__name__)

# Export to collector
otlp_exporter = OTLPSpanExporter(endpoint="otel-collector:4317")
trace.get_tracer_provider().add_span_processor(
    BatchSpanProcessor(otlp_exporter)
)

# Auto-instrument frameworks
FlaskInstrumentor().instrument()
RequestsInstrumentor().instrument()

# Custom span
with tracer.start_as_current_span("process-order") as span:
    span.set_attribute("order.id", order_id)
    span.set_attribute("order.total", total)
    process_order(order_id)
OpenTelemetry Collector
# otel-collector-config.yaml
receivers:
  otlp:
    protocols:
      grpc:
        endpoint: 0.0.0.0:4317
      http:
        endpoint: 0.0.0.0:4318

processors:
  batch:
    timeout: 10s
  memory_limiter:
    check_interval: 1s
    limit_mib: 1000

exporters:
  jaeger:
    endpoint: jaeger:14250
    tls:
      insecure: true
  prometheus:
    endpoint: 0.0.0.0:8889
  loki:
    endpoint: http://loki:3100/loki/api/v1/push

service:
  pipelines:
    traces:
      receivers: [otlp]
      processors: [memory_limiter, batch]
      exporters: [jaeger]
    metrics:
      receivers: [otlp]
      processors: [batch]
      exporters: [prometheus]
    logs:
      receivers: [otlp]
      processors: [batch]
      exporters: [loki]
Kubernetes Deployment
apiVersion: apps/v1
kind: DaemonSet
metadata:
  name: otel-collector
  namespace: observability
spec:
  selector:
    matchLabels:
      app: otel-collector
  template:
    spec:
      containers:
      - name: collector
        image: otel/opentelemetry-collector-contrib:latest
        args: ["--config=/conf/config.yaml"]
        ports:
        - containerPort: 4317
        - containerPort: 4318
        volumeMounts:
        - name: config
          mountPath: /conf
      volumes:
      - name: config
        configMap:
          name: otel-collector-config
Grafana Dashboard
# Terraform - Grafana dashboard
resource "grafana_dashboard" "service_overview" {
  config_json = jsonencode({
    title = "Service Overview"
    panels = [
      {
        title      = "Request Rate"
        type       = "graph"
        datasource = "Prometheus"
        targets = [{
          expr = "rate(http_requests_total[5m])"
        }]
      },
      {
        title      = "Error Rate"
        type       = "stat"
        datasource = "Prometheus"
        targets = [{
          expr = "sum(rate(http_requests_total{status=~\"5..\"}[5m])) / sum(rate(http_requests_total[5m])) * 100"
        }]
      },
      {
        title      = "P99 Latency"
        type       = "gauge"
        datasource = "Prometheus"
        targets = [{
          expr = "histogram_quantile(0.99, rate(http_request_duration_seconds_bucket[5m]))"
        }]
      }
    ]
  })
}
Alerting Rules
# Prometheus alerting rules
groups:
- name: slo-alerts
  rules:
  - alert: HighErrorRate
    expr: |
      sum(rate(http_requests_total{status=~"5.."}[5m]))
      / sum(rate(http_requests_total[5m])) > 0.01
    for: 5m
    labels:
      severity: critical
    annotations:
      summary: "High error rate detected"

  - alert: HighLatency
    expr: |
      histogram_quantile(0.99, rate(http_request_duration_seconds_bucket[5m])) > 1
    for: 5m
    labels:
      severity: warning
Conclusion
Effective observability requires correlation between metrics, logs, and traces. OpenTelemetry provides a vendor-neutral standard for instrumentation, while tools like Grafana, Jaeger, and Loki enable visualization and analysis of telemetry data.


